If you’re having network connectivity problems, you can run a traceroute to pinpoint exactly where your connection is failing. The traceroute command will provide you with information about your internet connection, website status, and more. Then you can give this information to your technical support representative to resolve your network connectivity issues. Here’s how to run a traceroute on Windows 10 and how to read your traceroute results.
What Is Traceroute?
Traceroute is a network diagnostic tool that tracks the path of a packet of data as it travels from your computer to a destination over the internet. Running a traceroute lets you see where your connection is slow or unresponsive.
You can think of the traceroute tool like a traffic map of your internet connection. When you run a traceroute, you will see all the “hops,” or routers that three separate packets are pushed through on their way to a destination. It will also show you your network’s latency, or how long it took for each packet to travel from one hop to the next.
If you just want to test your network’s latency, check out our step-by-step guide on how to do a ping test on your Windows 10 computer.
How to Run a Traceroute on a Windows 10 Computer
To run a traceroute on a Windows 10 computer, open the Windows search box and type CMD into the search bar. Then open the Command Prompt app and type in tracert followed by a space and then the destination URL or IP address. Finally, hit Enter.
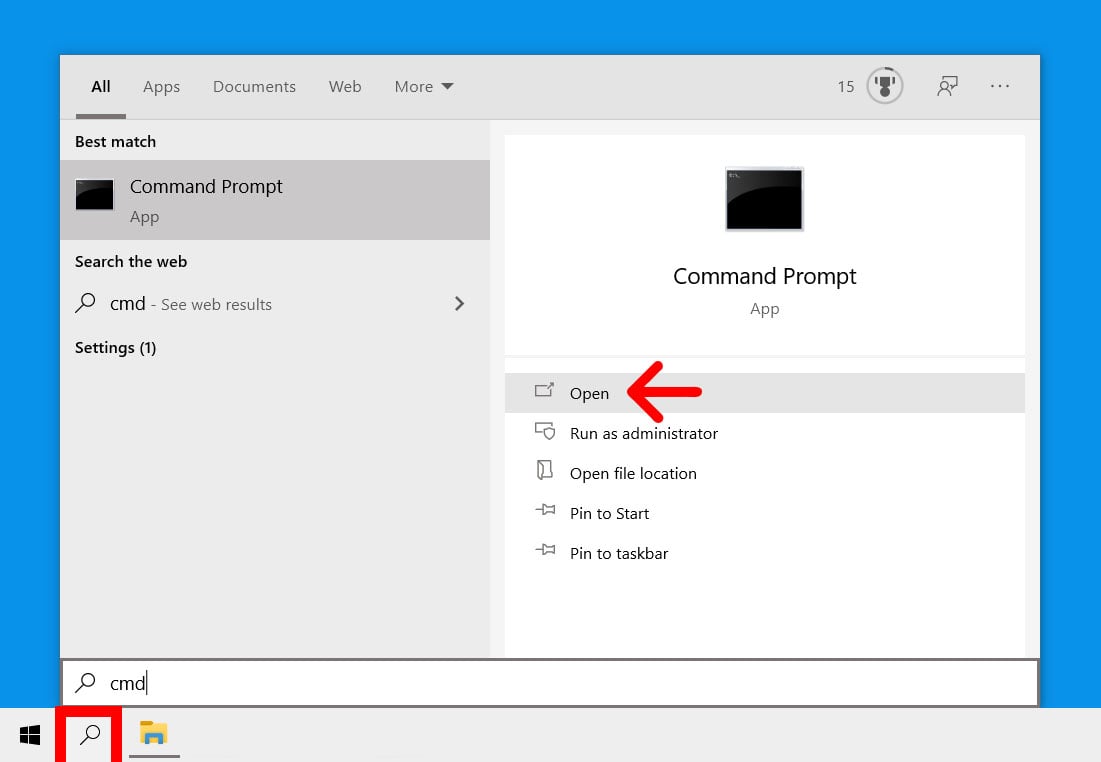
- Open the Windows search box. You can do this by clicking the magnifying glass icon in the bottom-left corner of your screen.
- Then type CMD in the search bar and click Open.
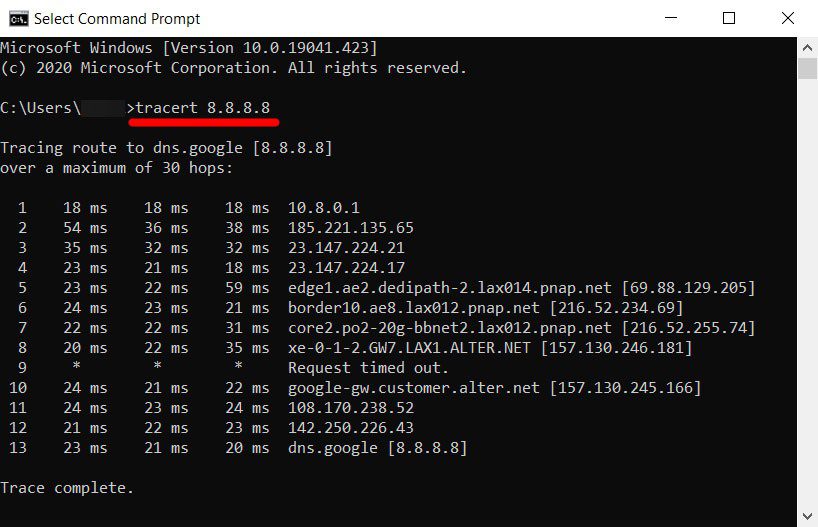
- Next, type tracert followed by a space and then an IP address or URL. If you just want to test your internet connection, it is a good idea to run a traceroute to 8.8.8.8 (Google’s DNS server). You can also run a traceroute to the URL of any website or IP address. Just make sure you leave a space after tracert and before the URL or IP address. For example, to run a traceroute to HelloTech.com, you would type tracert hellotech.com into the Command Prompt app.
- Finally, press Enter on your keyboard and wait for the traceroute to finish. You will see the words Trace complete when the process is finished. You can also stop a traceroute at any time by pressing the Control + C keys on your keyboard at the same time.
To copy the traceroute results, left-click and drag your mouse to select the traceroute results. Then press Enter on your keyboard. Next, open a document or text file and paste the traceroute results there.
How to Read Traceroute Results
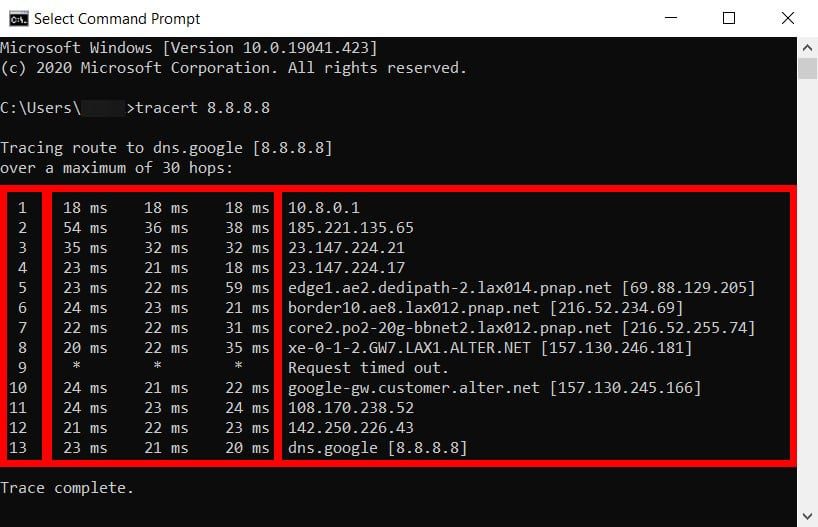
To read your traceroute results, look for the round trip time (RTT) in columns two through four. If you see any hops that took a long time or there is an error message in any of the rows, that might be where you have network connectivity problems.
How to Read the Traceroute Columns
- Column 1: This represents the hop number, or the number of hops that the three data packets were pushed through to reach the destination.
- Columns 2-4: These show the round trip time measured in milliseconds. RTT represents the time it took for a data packet to travel from the source to the destination and back again. To check for the consistency of the response times, the traceroute command sends three packets to each hop, which is why there are three time values listed per row. RTT values below 100 milliseconds are acceptable. However, if you see RTT values consistently increasing from the middle hop to the destination, it could be due to a network problem.
- Column 5: This column shows the name or IP address of the routers on every hop from your computer to the destination. It will also list the domain name of the router, if that information is available.
How to Read the Traceroute Rows
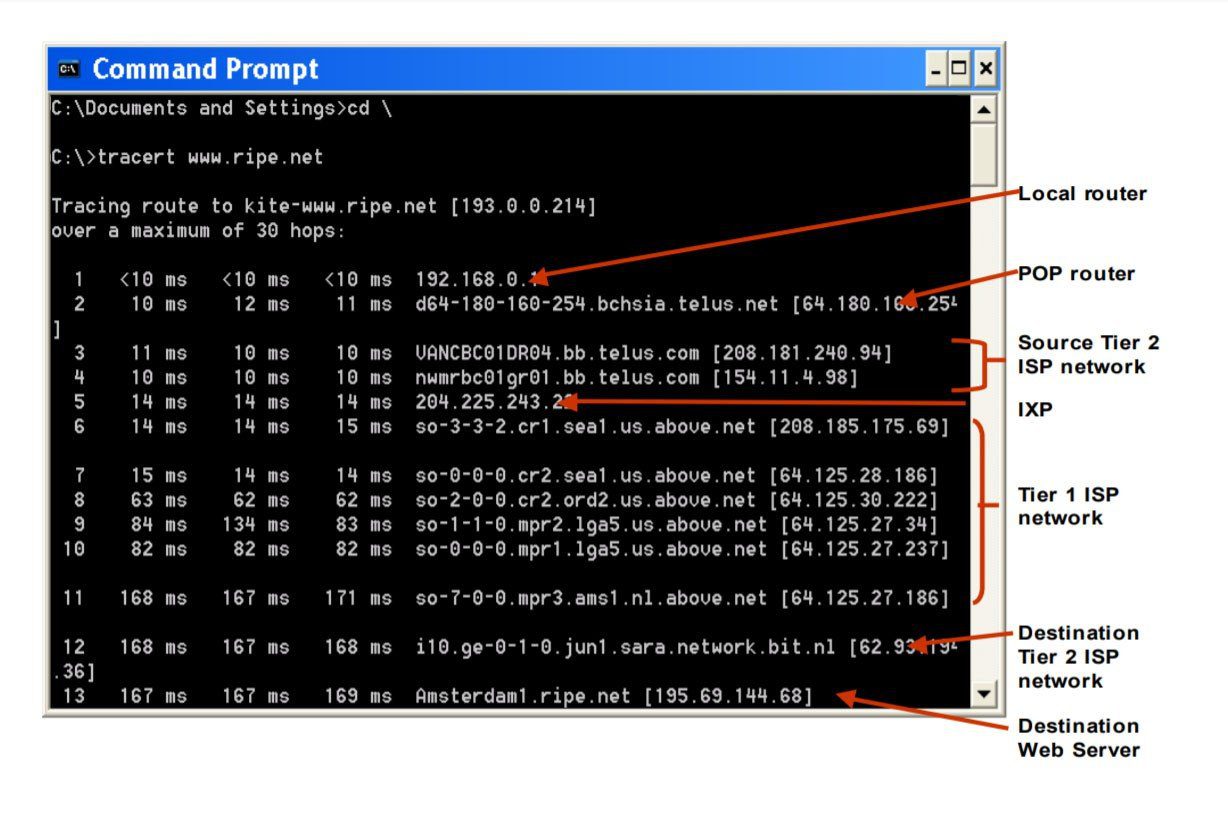
The traceroute results will show you the IP addresses for different points in the route. The addresses in the first few rows are from your source network, the middle hops are from internet service providers (ISPs), while the last ones are those near the destination.
- Local router. The first lines of the traceroute results will indicate your gateway’s IP address. In most cases, the first line will be your router’s IP address, which usually starts with 192.168.XXX.Xor 10.0.XXX.X. However, there are other router manufacturers that will have default IP addresses that start with other numbers. To find out which row your router is on, check out our guide on how to find your router’s IP address, and then compare it to your traceroute results.
- PoP router. A Point of Presence (PoP) is the local access point of your ISP. This access point helps your device establish a connection with the internet.
- Source Tier 2 ISP Network. Your request might be routed to a regional ISP (like Comcast or Cox), which services a limited geographic area. They pay Tier 1 providers for connectivity but also have agreements with other Tier 2 providers to exchange traffic directly. You might see your ISP provider’s name in lines three or four of the traceroute results.
- IXP. An Internet Exchange Point (IXP) is a physical location where ISPs and other network providers connect to exchange internet traffic. Here, administrators make routing decisions based on hop counts and other factors.
- Tier 1 ISP Network. These ISP providers are considered the backbone of the internet because they own the infrastructure to carry most of the traffic themselves. Tier 1 providers include AT&T, Sprint, and Verizon.
- Destination Tier 2 ISP Network. This is the regional ISP closest to the data packet’s destination and can appear in the second to the last line of the traceroute results.
- Destination Web Server. This is the last line in the traceroute results before the “Trace complete” message.
Common Traceroute Error Messages
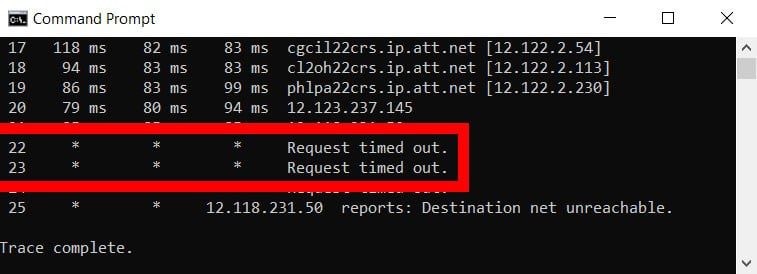
If there is an issue within the network, the traceroute results will also show error commands, which include Request timed out, Destination unreachable, * in RTT columns, and more.
- Request timed out: Seeing this error at the end of the traceroute means that a firewall or a security device might be blocking your request, or there was a problem in the return route. If you see this at the beginning, it’s nothing to worry about as it is a common hop.
- Destination net unreachable: This means that the data packets have stopped traveling within the network. Most of the time, this is because there is a problem with the router or that the website or IP address you are trying to reach is down.
- * in RTT columns: It means the router did not respond to the request within the maximum allotted time of two seconds. It could also mean that the router in the hop was not set up to provide a response to a traceroute request. However, it does not necessarily mean that the packet was dropped. To verify if there was a packet loss, you can ping the IP address of the router where you see the asterisk.
Traceroute Command Variations
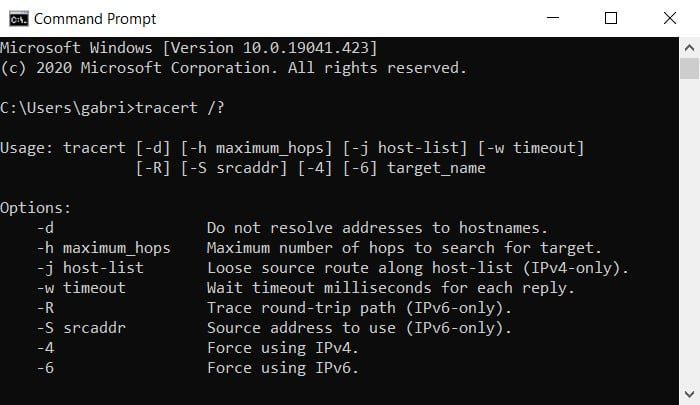
If you are looking for ways to run a traceroute, you can open the Command Prompt app and type tracert /? to see variations you can use.
Now that you know how to run a traceroute on your Windows 10 computer, check out our article on how to boost your WiFi signal.